Introducing Standard Software Options for the PA/WPA Series
Here are some of the representative software options for the PA/WPA Series.
Using these options allows you to see results that cannot be observed under the standard system configuration. Software options can be installed even by customers who already have the equipment.
※Depending on the version you are using, it may be necessary to replace the control PC. Please contact us for details.
Data processing Function
The “Data Processing Function” is the most widely adopted software option.
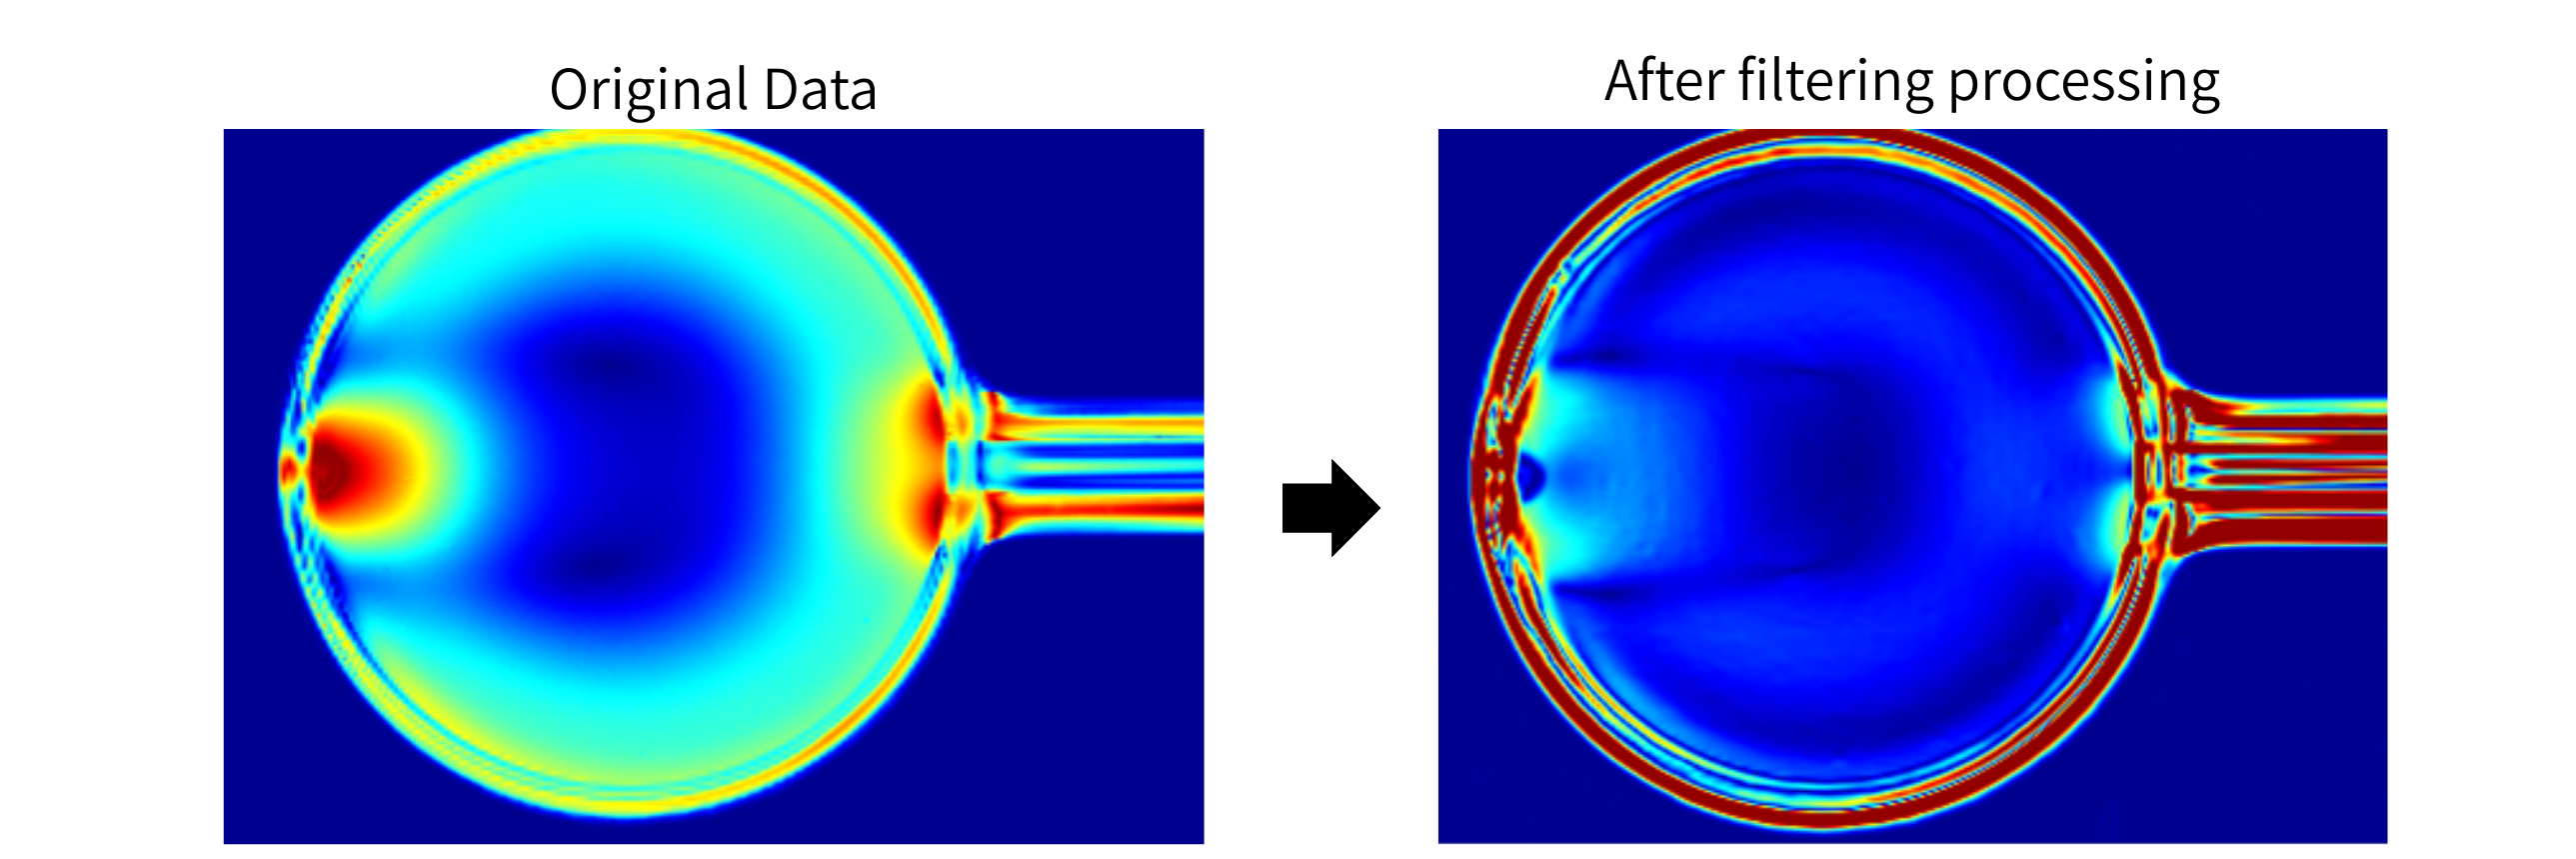
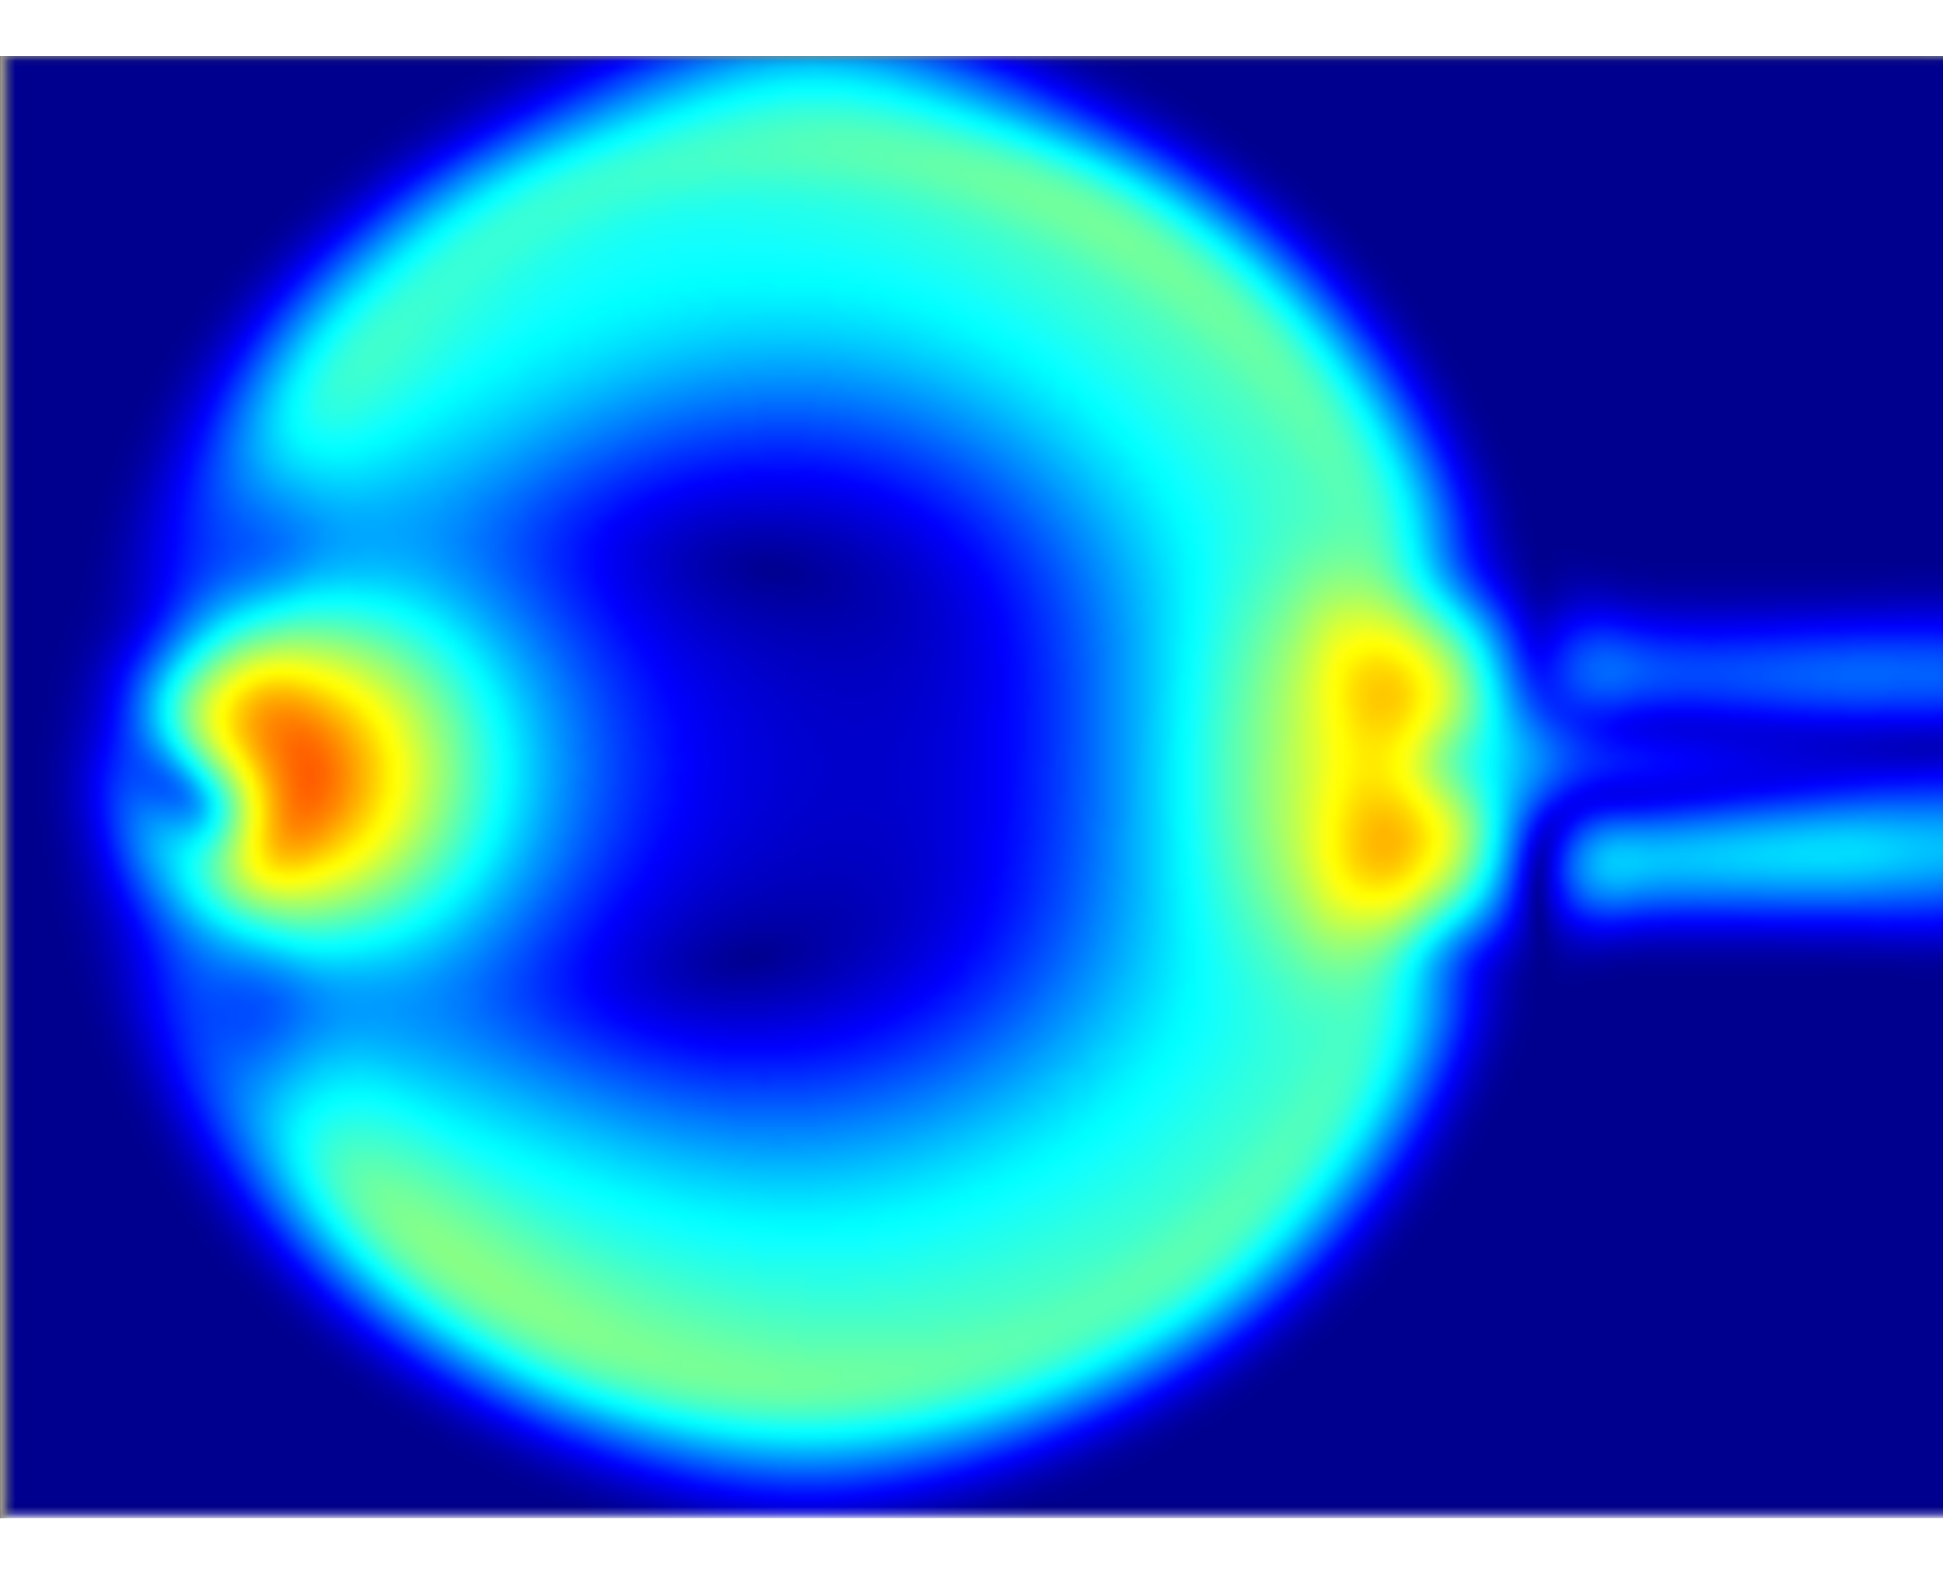
Seven types of filtering are available, including noise removal from measurement data, high-pass/low-pass filter processing, and tilt correction.
Median Filter
Reduction spike noise and isolated points/reduces the effects of duct, etc.
Averaging Filter
Reduction of random noise through spatial averaging.
Combining the Median Filter with the Averaging Filter significantly reduces spike noise and random noise in the measurement data.
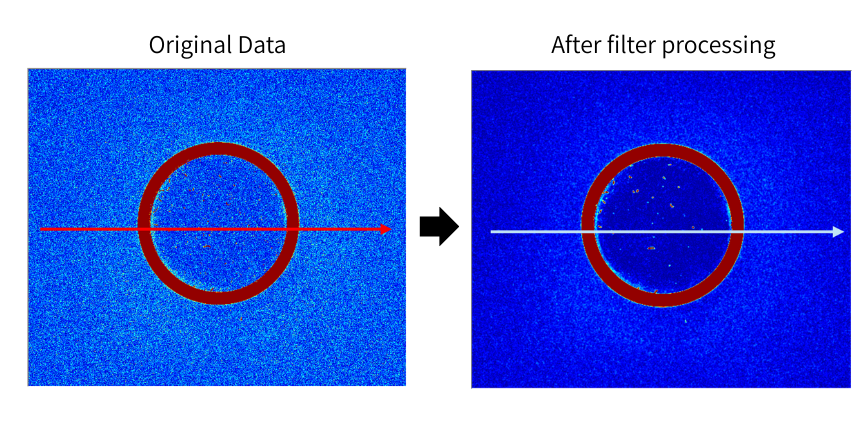
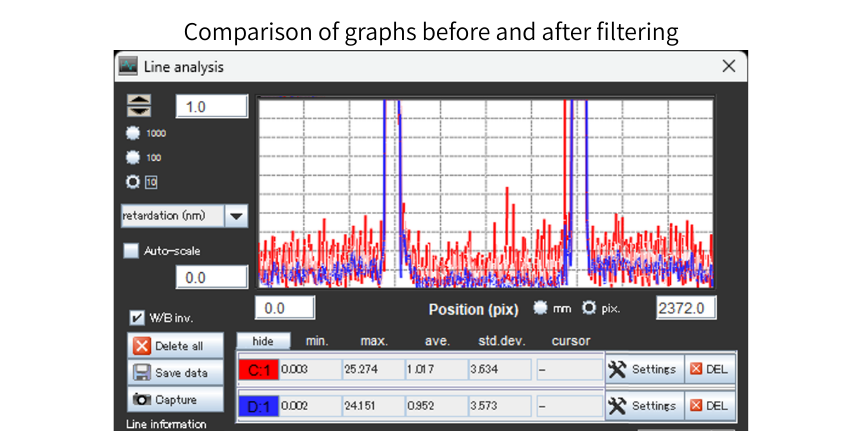
Noise reduced to about 1/3.
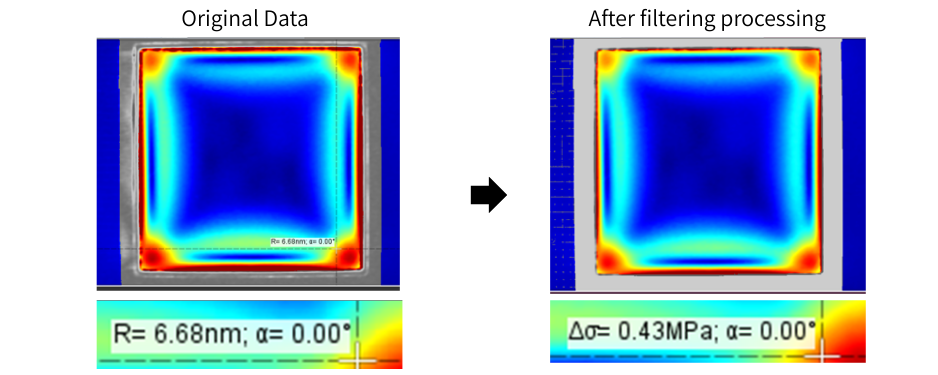
Stress Calculator
By inputting the photo elastic coefficient and thickness information of the material to be measured, the retardation distribution information can be converted into stress values (principal stress difference) in MPa units.
Arithmetic Filter
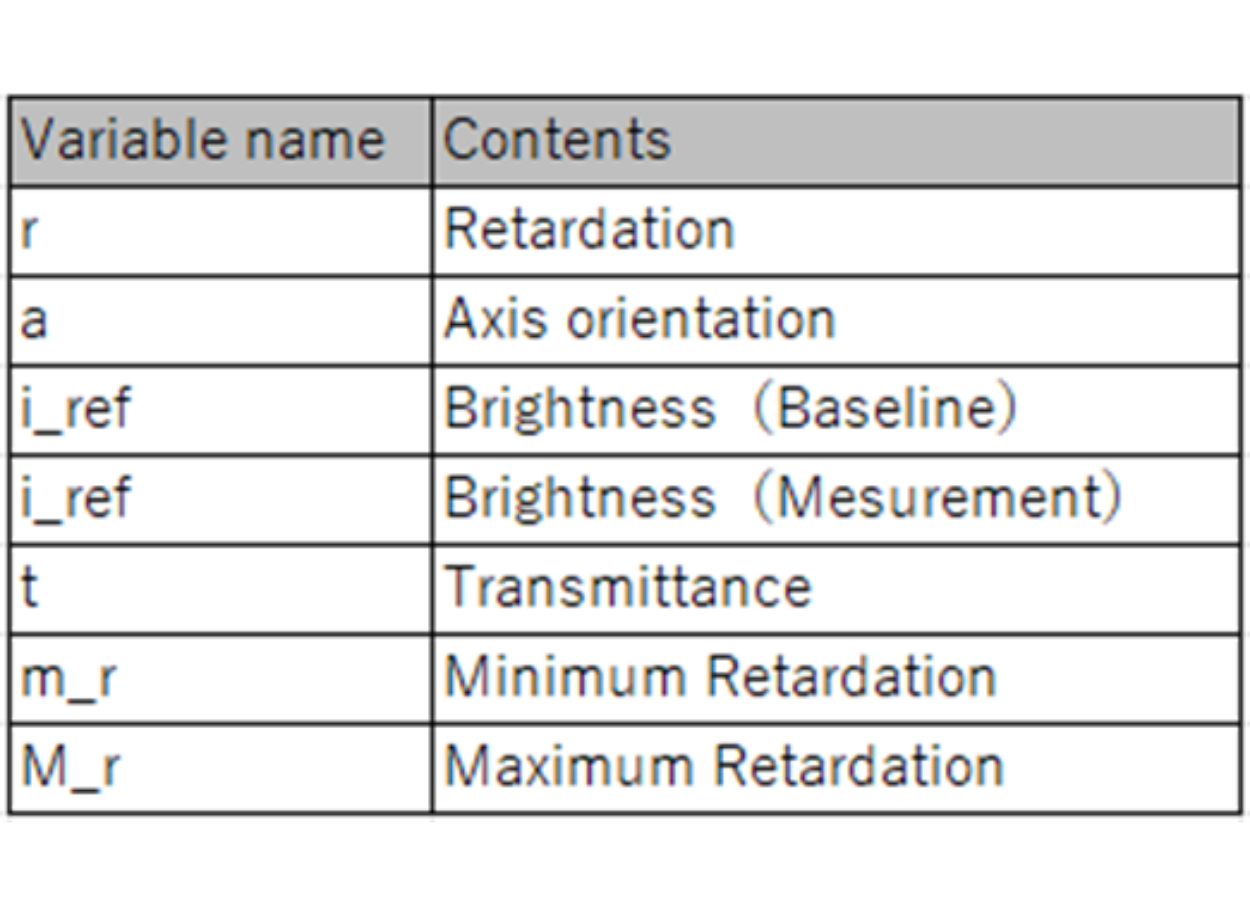
By inputting user-specified formulas, various calculations of retardation, axis direction, and brightness are possible, and data can be processed as desired.
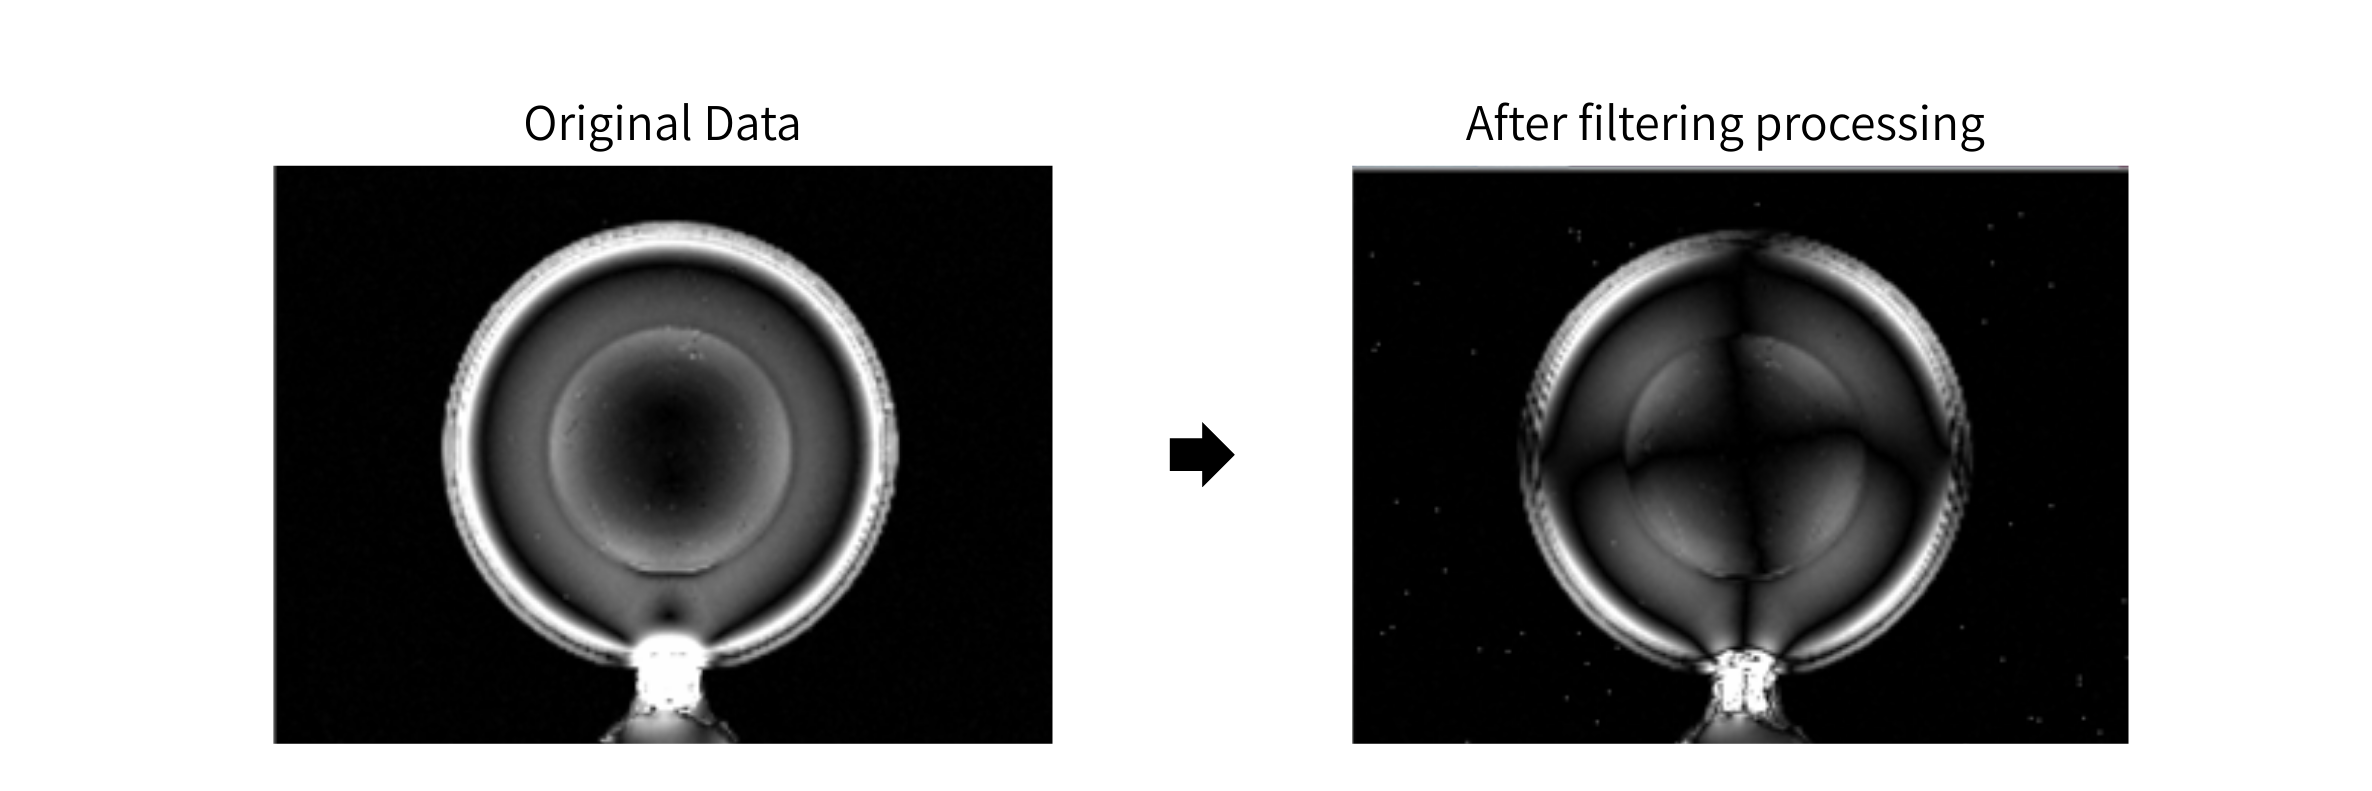
Calculation Example 1:Generation of a Crossed-Nicol Observation Image
Calculation Example 2:Difference calculation of multiple data
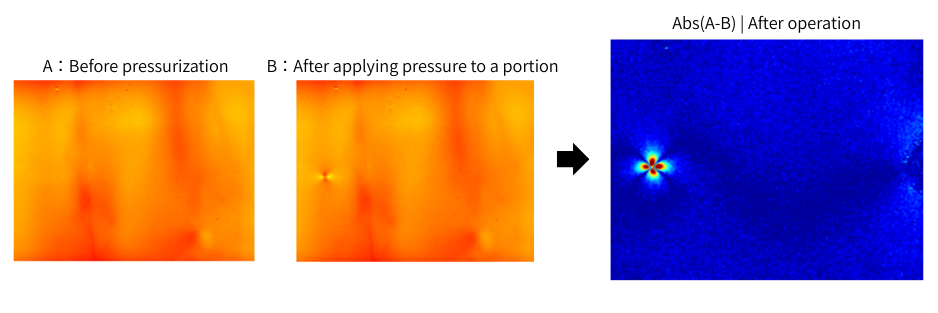
Available Functions:Addition, Subtraction, Multiplication, Division, abs, sin, cos, tan, asin, acos, atan, max, min, sqrt, random, exp, log, etc.
Sobel Filter
This filter makes local patterns more apparent by emphasizing local variations and weakening smooth undulations.
※The average filter performs processing that is almost the opposite of the Sobel filter.
Other filtering operations include:
Tilt correction
Forcefully corrects the tilt to a level position.
Frequency Filter
Cut frequency components / detect defects.
Lens analysis function
The feature of this option is that it automates the entire process from detecting circular samples such as lenses to measuring, judging, and saving the data, thereby reducing inspection man-hours and preventing operator errors.
Pass / Fail judgment
Pass / Fail determination of the command area in retardation distribution data is possible under arbitrary conditions.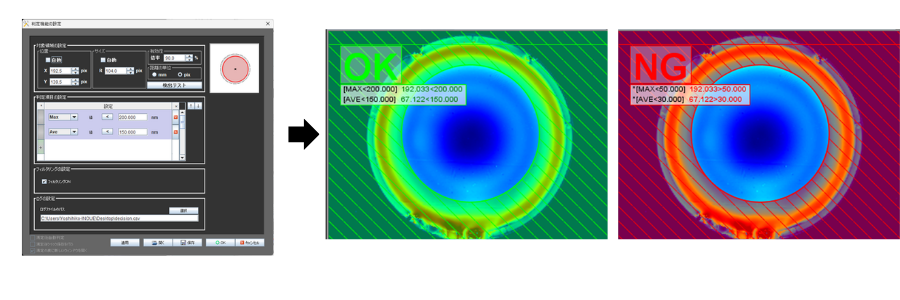
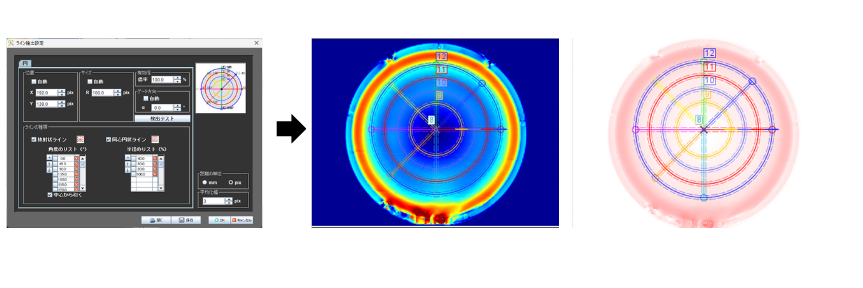
Automatic creation of lines for graphs
Concentric circles of any radius and radial lines at any angle can be created and graphed.
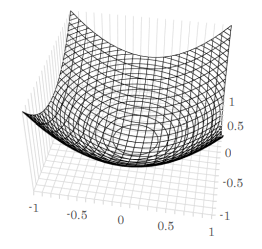
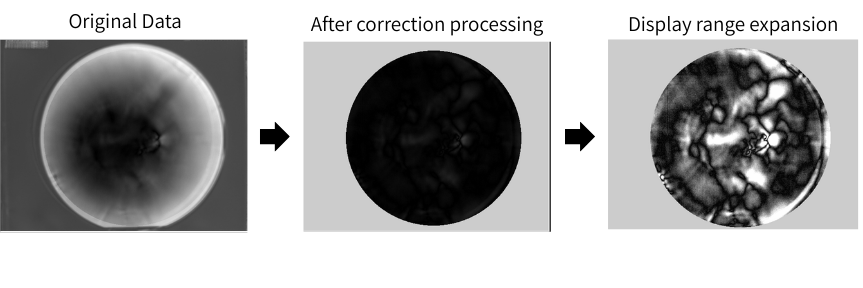
Field-Of-View (FOV) correction function
When the measured object is placed at the edge of the stage, some samples exhibit distribution in peripheral measurement values due to the field of view. This is often caused by molecular orientation or crystal orientation and is difficult to resolve with normal measurements. This option obtains only the retardation that is actually required, eliminating the apparent retardation caused by the viewing angle and correcting data distribution that occurs around the periphery of the screen.
Correction of bowl-shaped distribution
Corrects the distribution where the center is close to 0.
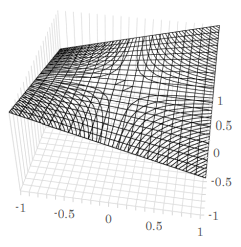
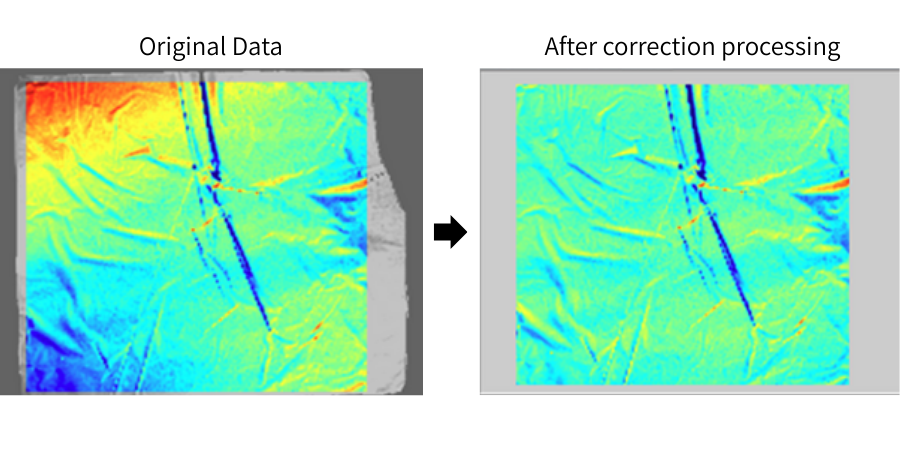
Correction of saddle-shaped distribution
Eliminate fixed patterns where the four corners increase or decrease
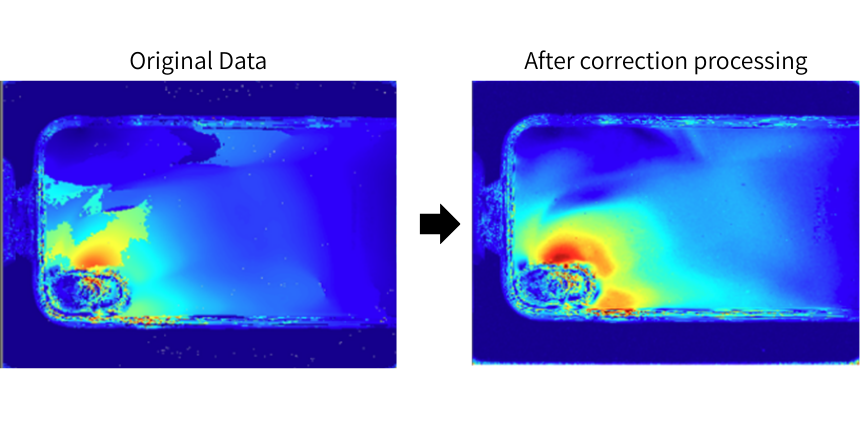
Chromatic dispersion mode(CD mode)
The wavelength dispersion mode(CD mode)uses a unique algorithm to calculate highly reproducible retardation even in areas where polarization changes are complex.
Suppresses “Data jump” that commonly occur in molded parts with a thickness of 5mm or more, reducing the occurrence of abnormal values.
Correction of data jump points
Reduces measurement errors that can occur when measuring resin molded products with large retardation.
A 30-day free trial is available.
The options we introduced can be experienced free of charge for 30 days using the viewer available for download from our website.。Please try it!!
Click here to download.